5 Key Metrics to Look at Before Buying Any Stock
Introduction
When you're looking to buy a car, you don't just look at the paint job—you pop the hood to check the engine. Investing in a stock should be no different. The company's stock price tells you what you'll pay, but its underlying financial metrics tell you what you're actually getting.
Navigating financial statements can be intimidating, but you don't need to be a Wall Street analyst to make smart decisions. By focusing on a handful of key numbers, you can get a powerful snapshot of a company's health and valuation. Think of these five metrics as your pre-flight checklist before you invest.
1. Price-to-Earnings (P/E) Ratio
- What It Is: A valuation metric.
- How to Calculate It: - Formula: $P/E Ratio = Market Price per Share / Earnings per Share
- Example: If a stock is trading at $50 per share and its earnings per share for the year are $2, the P/E ratio is $50 / $2 = 25$.
- What It Tells You: The P/E ratio is the simplest way to see if a stock is cheap or expensive. It tells you how much you are paying for every single dollar of the company's profit. A high P/E suggests that investors expect high future growth, while a low P/E might indicate a stock is undervalued—or that the company is facing challenges.
- What to Look For: There's no single "good" P/E ratio. The key is context. Compare a company's P/E ratio to its direct competitors and its own historical average.
2. Revenue Growth
- What It Is: A growth metric.
- How to Calculate It: - Formula: (Current Year's Revenue - Previous Year's Revenue) / Previous Year's Revenue
- Example: If a company had $1 billion in revenue last year and $1.2 billion this year, the revenue growth is ($1.2B - $1.0B) / $1.0B = 20%.
- What It Tells You: Is the company actually expanding? Revenue growth answers this by showing the rate at which its sales are increasing. A company that isn't growing its sales is a stagnant business.
- What to Look For: Consistent, year-over-year revenue growth. Strong, sustained growth is a clear sign that the company's products or services are in high demand.
3. Debt-to-Equity (D/E) Ratio
- What It Is: A risk and solvency metric.
- How to Calculate It: - Formula: $D/E Ratio = Total Liabilities / Total Shareholder Equity
- Example: If a company has $500 million in liabilities and $1 billion in shareholder equity, the D/E ratio is $500M / $1B = 0.5$.
- What It Tells You: This ratio shows how much of a company's operations are funded by borrowed money (debt) versus the money from shareholders (equity). A company that relies too heavily on debt can be risky, as it must make interest payments no matter how the business is doing.
- What to Look For: Generally, a lower D/E ratio (under 1.0) is considered safer. However, this can vary wildly by industry, so again, compare it to its peers.
4. Return on Equity (ROE)
- What It Is: A profitability and management efficiency metric.
- How to Calculate It: - Formula: $ROE = Net Income / Total Shareholder Equity
- Example: If a company has a net income of $100 million and total shareholder equity of $500 million, the ROE is ($100M / $500M) * 100 = 20%.
- What It Tells You: ROE is one of the best indicators of a high-quality business. It measures how effectively the company's leadership is using the money invested by shareholders to generate profits. In essence, it answers the question: "How good is this company at turning my money into more money?"
- What to Look For: A consistent ROE above 15% is often considered a sign of a strong, well-managed business.
5. Free Cash Flow (FCF)
- What It Is: A cash-generation metric.
- How to Calculate It: - Formula: $FCF = Operating Cash Flow - Capital Expenditures
- Example: If a company's operating cash flow is $200 million and it spends $50 million on capital expenditures, its FCF is $200M - $50M = $150 million.
- What It Tells You: If profit is an opinion, cash is a fact. Free cash flow is the actual, spendable cash a company has left over after paying for all its day-to-day operations and investments. This is the cash that can be used to pay dividends, buy back stock, or expand the business. It's arguably the most important metric for determining a company's true financial strength.
- What to Look For: Positive and, ideally, growing free cash flow. A company that consistently generates more cash than it spends is a healthy and sustainable business.
The Shortcut: finding all these metrics can be tedious 🥱, Equity Analyzer provides all of them instantly on any stock you are researching on! 🤩
Conclusion
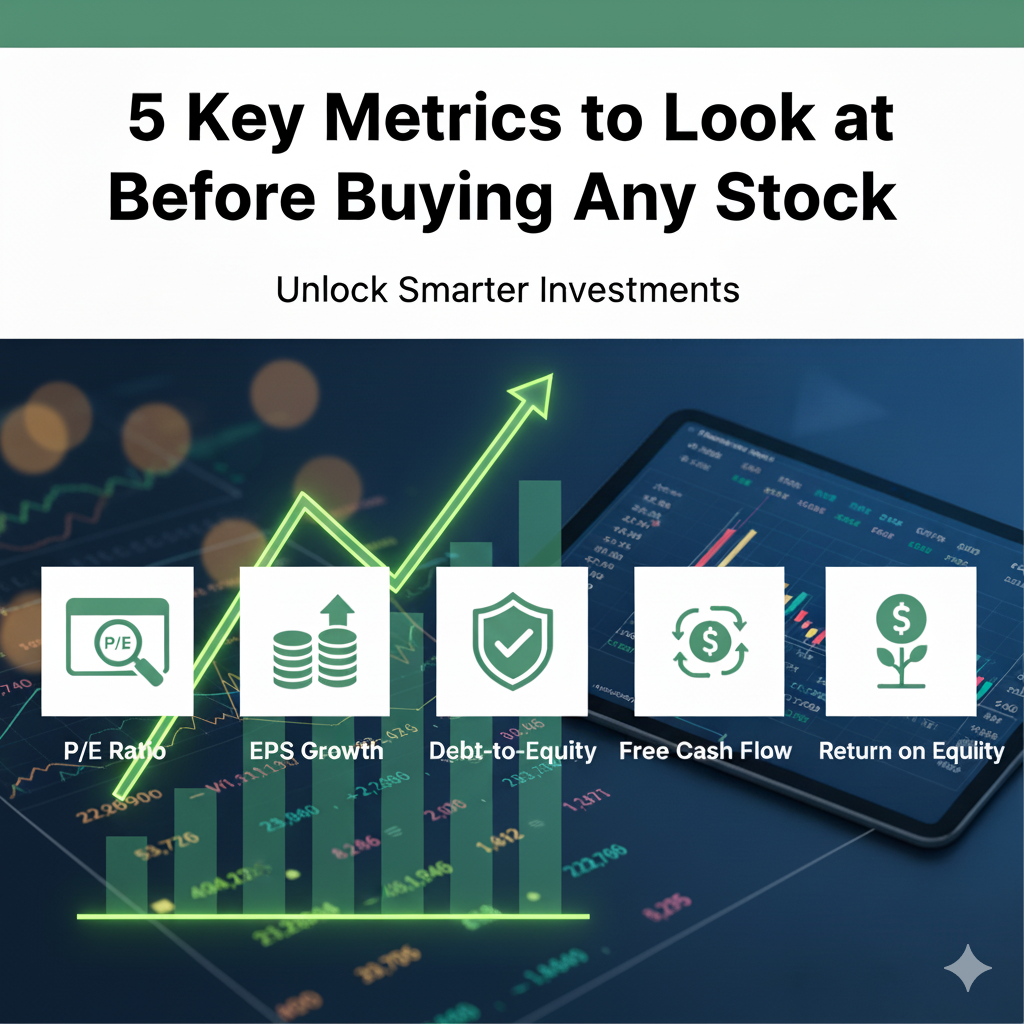
You wouldn't buy a house without an inspection, and you shouldn't buy a stock without checking its vitals. By using the P/E ratio, revenue growth, debt-to-equity, return on equity, and free cash flow as your checklist, you build a strong foundation for every investment. This simple habit will help you avoid risky companies and identify high-quality businesses poised for long-term success.
Automate Your Research
Manually gathering data takes hours. Equity Analyzer uses AI to generate a full, institutional-grade report on any stock in seconds.
Analyze Your First Stock for Free →